Download these files and then open them with a computer sound editor such as CoolEdit (for PC's) or SoundEdit (Mac's). The files labeled ".wav" are in the default sound format for MS-Windows and those labeled ".aif" are in the default format for Macintosh, though most sound editors can open both types. For each file, there are also links to screenshots of the sound in CoolEdit, both of its waveform and spectrum.
The full views of the waveform are useful for observing the overall amplitude vs. time, so that you can follow the events as they unfold. The ZOOM'ed in views of the waveform show the individual cycles, and the time scale in the lower right corner can be used when calculating frequency (cycles/sec). On the other hand, the Spectral View (as it's called in CoolEdit) is also called a spectrogram, and it displays frequency on the vertical axis, time on the horizontal, and intensity as color.
Most of the sound files are intended to stimulate questions such as:
What similarities and what differences do you notice among the waveform views of the tones?
What's the frequency of each tone?
What similarities and differences do you notice about the way the tones sound, either in pitch or timbre (tone color)? Can you relate any of this to their waveforms?
What similarities and differences do you notice among the spectrograms of each sound? Can you relate these to the way they sound?
Can you identify each of the instruments? Find 2 similarities and 2 differences among the sounds, their waveforms, or their spectra. If the sound is played backwards (reversed), which instruments sound about the same, and which sound different? Why?
Download 3tones.aif, 3tones.wav, screenshots of full view, zoomed (40 msec) violin, trumpet, and piano, or spectrogram (or in inverted colors, for printing).
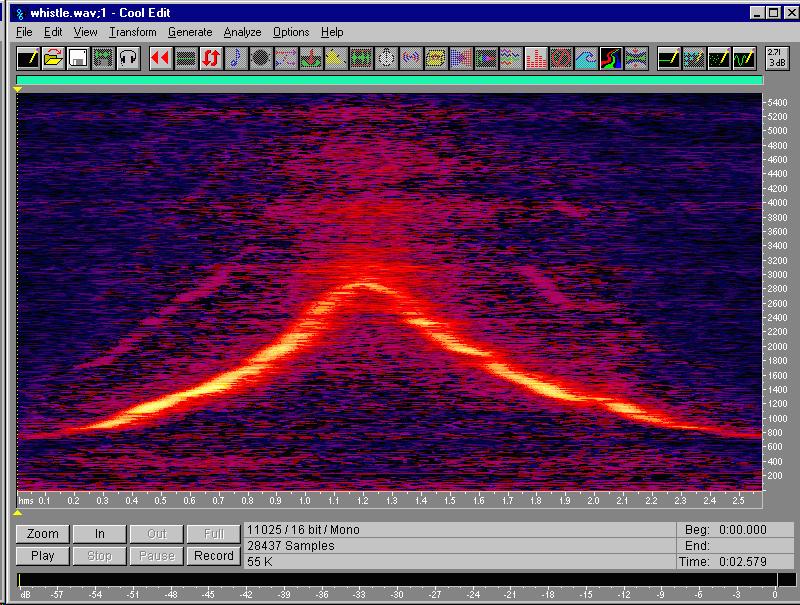
Zoom in and calculate the frequency by counting waveform cycles. Do this by highlighting a section and press Zoom. The time display (in the lower right corner for CoolEdit) shows how many seconds are highlighted (0.040 sec is a good starting point). Try this at several points in the file. Then, display the spectrogram (Spectral View) and watch the whistle frequency rise and fall over time.
Download whistle.aif or whistle.wav, screenshots of full view, zoomed (40 msec) after 0.3 sec, 0.5 sec, and 0.9 sec, or spectrogram (or in inverted colors).
This is a good starter file, if you can't record your own. Watch the events unfold across the screen in Waveform View. How is time displayed in this graph? How is amplitude displayed? Can you pick out the various events (such as words, or syllables) just by looking at the waveform view?
Download phun.aif or phun.wav.
These three tones were originally played at different loudnesses, and then recorded so their amplitudes are the same. Which one was originally played softly? Which one was played loudly? How can you tell? What similarities and differences do you notice among these?
Download tpt3tone.aif or tpt3tone.wav.
Five vowels spoken by the same male speaker, at a normal pitch. Find 3 similarities and 3 differences among the vowels, in waveform, envelope, spectrogram, pitch, or sound.
Download aeiou.aif or aeiou.wav.
The same vowels as before, spoken by the same person, but at a higher pitch. What similarities can you find between this example and the previous one? What differences can you find?
Download aeiou2.aif or aeiou2.wav.
If you click on the sound file link, it will probably just start playing. If so, then you should be able to do File | Save As (or some similar command) to save the sound file to your own computer. An alternative is to download the file directly (in Netscape on a PC, right-click on the link, and choose Save Link As...)
If you want to go further and study the nature of voices or musical instruments, the spectrogram best shows how such complex tones are composed of a collection of pure tones. Each of these components is called a partial tone or partial. Any description of the various frequencies that make up a complex tone, and the amounts of those frequencies, is called a spectrum, in analogy with the different colors of the light spectrum.
If the partials are evenly spaced vertically on the frequency axis (starting from the bottom, zero frequency), then their frequencies are integer multiples of some fundamental frequency, and the partials are therefore called harmonics. The fundamental frequency corresponds closely to the pitch of the note you hear. A voiced vowel sound is harmonic, but it will show some regions of partials more enhanced than others; each enhancement is called a formant. The formants correspond to resonances of the vocal tract, and they shift in frequency as different vowels are pronounced.
The activity Make a Flute has a design for a flute, including tone hole sizes and positions. If you want to modify this design for a different scale or a different tube diameter, you can use the same design tool that was used for the Make a Flute design.
Here's how it works: A small hole doesn't open the tube as effectively as a large hole, and a large hole isn't as effective as cutting off the tube with a saw. So, to get the right positions for the holes so the notes are in tune, the designer must start with the ideal tube lengths, but then take account of the various equivalent lengths that make the tube seem longer, acoustically, than it is. The Flute spreadsheet has all of these acoustical corrections programmed into it. It takes students about 2-3 hours to design a flute using this spreadsheet, including the time spent learning how changes to one hole affect the optimum positions for neighboring holes.
The following link will take you to a page where the Flute spreadsheet is available in a variety of formats. Click here. As is, this design will play a good scale in the low register, but its hole sizes are too small, which ends up making the second register too flat (it should be exactly one octave higher). This is done on purpose, to encourage each person to develop their own flute design and to explore on their own the interactions between the holes. But, as a tip, I'll point out that the design in Make a Flute has all the hole sizes bigger by 1/16" (0.16 cm). Further instructions can be found on the spreadsheet, or in this activity used at Baldwin-Wallace College for PHY101 - Acoustics, a general education course. Have fun!
This page is incomplete, and was most recently updated on 20 October, 1999.
If you have any questions or problems, contact me at phoekje@bw.edu.