 Figure 1
- The Audacity window
Figure 1
- The Audacity windowUsing Sound Spectrum to Find the Pitch Octave of a Musical Instrument for the Science Olympiad Sounds of Music event
Peter Hoekje, 8 February, 2006
Dept. of Physics and Astronomy, Baldwin-Wallace College, Berea, OH
Email: phoekje@bw.edu, Webpage: http://homepages.bw.edu/~phoekje
An important part of the scoring of the Sounds of Music event is the pitch range of the instrument. If one of the instruments of the team plays outside of the correct range, then that team’s score is ranked in a lower tier, behind teams even with lower point scores but which meet the rule requirements. Unfortunately, automatic tuners often do not give reliable information for the purposes of this event, and not all of us have the ability to correctly match pitches with a piano. As a result, a very large fraction of instruments fail this aspect of the judging, even at the state level. This document is written to explain how to use sound editor and analysis software to determine the pitch of an instrument without ambiguity.
Frequency and Pitch
First of all, there are some important definitions to be made, including the distinction between pitch and frequency. Frequency has the units of cycles/second or hertz (Hz), and is a quantity that can be measured by a machine. Pitch is a human perception which closely related to the frequency of a sound. Generally, high frequencies correspond to high pitches, and low frequencies to low pitches.
The pitch of a sound might be described as a musical note name such as C4, or as a relative distance in semitones or in cents from another note. A common standard defines the pitch A4 to correspond to a frequency of 440 Hz. This pitch designation has two parts: the name of a scale note, designated by a letter and an optional sharp or flat, such as A, C#, or Bb; and, an octave designation, in this case, the octave 4. If the frequency is doubled, it corresponds to the same pitch but one octave higher, so that A5 corresponds to 880 Hz, and A3 corresponds to 220 Hz.
The sound of a musical instrument often contains many frequencies, even though it has one pitch. How these frequencies are related to the pitch depends on whether or not the frequencies are harmonically related, that is, whether the frequencies can fit the series 1,2,3, etc. A computer with a microphone and sound analysis software can be used to view these frequencies.
Getting the Materials
Computer (MS-Windows, Mac OSX, or Linux) with sound capabilities
Microphone
Sound analyzer software (e.g. Audacity, http://audacity.sourceforge.net)
The basic platform for this sound spectrum analysis is an ordinary computer, whether desktop or laptop; it should have the capability to record and play back sound, which is normally true for computers these days. The inexpensive microphones designed for computers and costing just a few dollars have sufficiently high quality for the purposes of examining the pitch. The Audacity software is available for three popular operating systems: MS-Windows, Macintosh OSX, and Linux. Audacity was designed by Dominic Mazzoni and it can be obtained for free download from the SourceForge.net website: http://audacity.sourceforge.net. The examples described in this document use version 1.2.4.
Recording a Sound
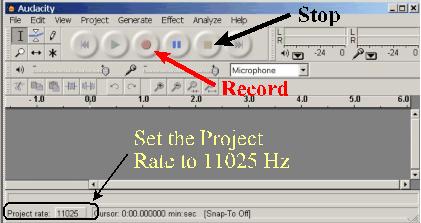
Figure 1
- The Audacity windowStart Audacity, and plug in the microphone. In the lower left hand corner is a box labeled Project Rate which is the sampling rate; click this box and select 11025 from the list. Then, from the large circular buttons near the top, click the Record button, which is the one with the red circle. This will start recording. The button with the yellow square will stop it.
If the instrument is reasonably loud, then the microphone does not need to be very close to it. However, for a quiet instrument or for a chime type of instrument, then the microphone should be placed close to it. Audacity shows a slider for the microphone volume, as well as bar meters that show the sound level as it is being recorded. Adjust the microphone volume until the green bars on the meter respond strongly as the instrument is played, but it is VERY IMPORTANT that the bars not get all the way to the 0 mark, which would cause distortion.
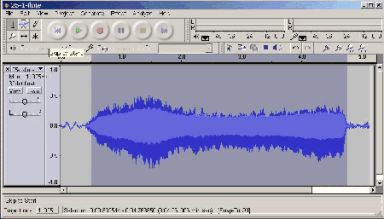 Figure 2 - A flute sound in Audacity
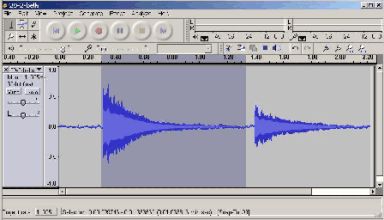 Figure 3 - A bell sound in Audacity
Play a note on the instrument. If the instrument can play a continuous sound, such as a flute, then play a couple of seconds with a nice, clear, steady tone. If the instrument is plucked like a string, or struck like a chime, then play the note once, and then play it again after a second or two. It is quite possible that the sound was recorded clearly but can’t be heard. Audacity can make the waveform larger. By clicking and dragging the mouse from left to right in the waveform window, select the section that contains the instrument sound. Or, choose the menu item Edit | Select All to highlight the entire waveform. Then, choose Effects | Normalize, which will make the entire wave larger and louder so that the loudest part just fits the height of the window.
Figure 2 shows the recorded sound of a flute over 5 seconds; the horizontal axis is the time, and the vertical axis is the amplitude of the sound. The sound starts around 0.5 seconds and lasts until 4.8 seconds. The dark gray background shows the part that has been highlighted with the cursor. Figure 3 shows a file which is 2.2 seconds long and contains two sounds from a copper pipe bell; the amplitude of each sound clearly decays in the way of a bell. Both Figure 2 and Figure 3 show sections of the sound which have been highlighted in order to analyze them.
On the menu bar, choose Analyze | Plot Spectrum to display the frequency spectrum. Figure 4 shows the spectrum of the flute sound. The horizontal axis shows frequency, but the labeling is a little confusing. The highest frequency is half the sampling rate, in this case, about 5500 Hz. The vertical axis is amplitude. The circled box shows the number of points in the spectrum, and can be changed to improve the clarity of the spectrum, but 512, 1024, and 2048 are usually good choices. Notice that this one sound has many frequencies in it, but in particular some tall peaks. This vertical scale is in decibels, and shows a very wide range. The difference between the first peak around 400 Hz and the noise around it is about 40 dB, which corresponds to a factor of 10,000 times in energy! Thus, the features that we focus upon are these peaks.
 Figure 4
- Frequency spectrum of the flute sound
Figure 4
- Frequency spectrum of the flute soundNotice the peaks of the flute sound are evenly spaced horizontally. This is an example of a harmonic spectrum. The cursor has been placed on the first peak, and the peak frequency is reported as 438 Hz (A4). This peak is called the fundamental, or first harmonic, and all the other frequencies are integer multiples of this one. So, the second harmonic has frequency 2x438=876 Hz, the third harmonic is 3x438=1344 Hz, etc.. For a harmonic spectrum, the frequency that corresponds to the pitch is the fundamental. So, this sound corresponds to A4.
Other instruments that have harmonic, or nearly harmonic, spectra include flutes, clarinets, saxophones, trombones, violins, guitars, and so forth. There are some variations in what will be seen. The first harmonic or fundamental may not be the strongest peak or even present, but as long as the other peaks fit the harmonic pattern, the pitch still corresponds to the first harmonic. Or, there might be other harmonics that are weak or missing, without changing the result.
However, bells and other percussion instruments are more difficult, because their frequencies are not harmonic and the pitch is not clear. Figure 5 shows the spectrum of the bell sound.
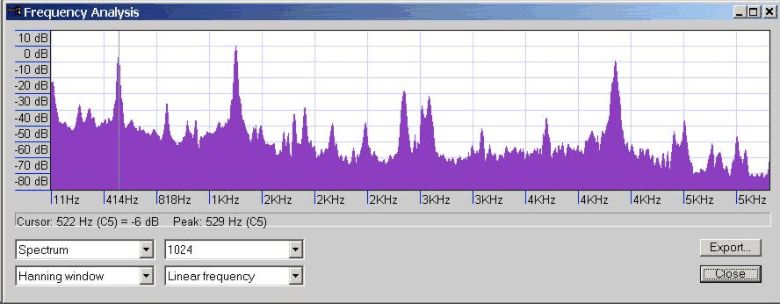 Figure 5 - Frequency spectrum of the
bell sound
Figure 5 - Frequency spectrum of the
bell soundThis spectrum shows many peaks, and none of them exhibit an evenly spaced, harmonic pattern. Here, the ear will usually try to pick out the largest peak, the loudest sound. The three largest peaks in this example are at 529 Hz, 1427 Hz, and 4333 Hz. These three peaks are about the same height, and the ear will have some confusion, perhaps identifying any one of them. But, for our purposes, the large peak with the lowest frequency is probably a good guess for what most people will hear. An electronic tuner also might lock on to any of these, but usually will also pick the one with the lowest frequency, in this case, 529 Hz (C5).
SUMMARY
♬ An electronic tuner can report the fine tuning frequency of a tone, but usually does not report the correct octave.
♬ To find the correct octave, the frequency spectrum of the sound should be analyzed, and the combination of a computer and software such as Audacity makes a good tool.
♬ For a harmonic spectrum, the pitch corresponds to the frequency of the first harmonic or fundamental, whether or not that harmonic is actually present in the sound.
♬ For a nonharmonic spectrum, the pitch corresponds to the lowest frequency strong peak in the spectrum.